Analytics reports can be created, viewed, and downloaded using the desktop versions of the PhoneLine+ app. However, this feature is not yet available for the mobile versions of PhoneLine+.
View and generate analytics reports
To view, create or download a report based on call statistics, click on the ‘Analytics’ pie chart, then click ‘Reports’.
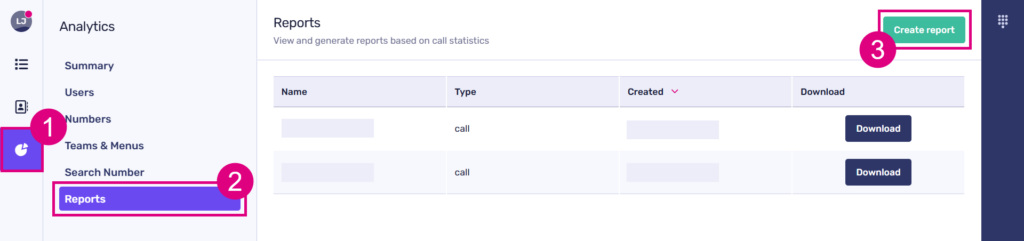
A list of existing reports will be displayed here.
Click ‘Create report’ to generate a new one.
Add a name for your new report, then select the report type.
Select the desired date range for generating your report data, and then choose the data fields to include, such as a PhoneLine+ user name, the name of the team, and additional relevant information.
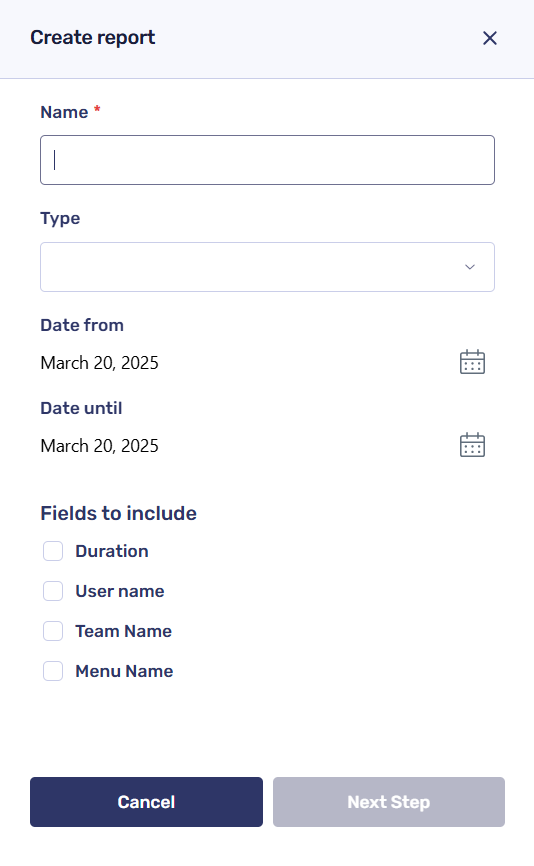
Once you have completed this section, click ‘Next Step’ to choose the numbers, users, menus, and/or teams for which you would like to gather data. You can add as many items as needed by simply clicking on each data item. A tally will be recorded in red along the top.

When you’re done, scroll all the way down to click ‘Create report’. This will now show on the ‘Reports’ screen, where you can download it to your computer. It is important to understand that reports cannot be modified or deleted once created. If you need to make changes to an existing report, you will have to start anew and create a new report from scratch.
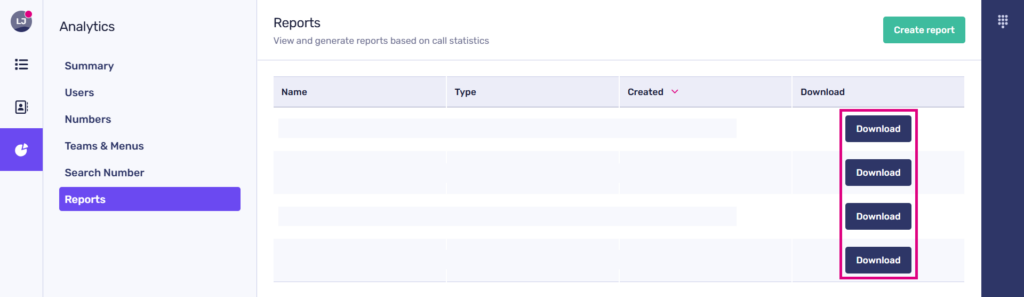
Downloading a report
Simply click the ‘Download’ icon next to the report you want to export. This will automatically generate a CSV file that will be delivered to your computer’s ‘Downloads’ folder (for Windows), or the ‘Downloads’ folder located in your user folder (Mac).